WNBA Contrarian Betting: Why Are Playoff Teams Overvalued?
The 2015 WNBA season tipped off on June 5th and once again it was greeted by limited fanfare. Although both TV ratings and attendance have been slowly climbing, in large part due to the increased popularity of social media, it’s still largely ignored by bettors.
This dearth of WNBA bettors can be easily identified by the massive and often unpredictable line movements. While most sports won’t see the spread move more than a couple of points (with the exception of an injury to a key player), WNBA games routinely see massive fluctuations. Less than a week into the season, we’ve already seen a game in which the Tulsa Shock moved from +6.5 to -2. That 8.5-point line move is unheard of in other major sports and reflects the lack of public money across the WNBA marketplace.
With so little public money hitting the marketplace, the value of betting against the public is severely limited. We’ve explained in the past how bettors can identify WNBA sharp money, but we wanted to examine how we could apply our contrarian philosophy to WNBA betting.
There are many staples to contrarian betting which we see applied across all six major sports leagues. These include not only betting against the public, but also ensuring that you buy on bad news and sell on good. That means bettors should be fading the league’s top teams, betting on teams who lost their previous game, and generally ignoring whatever narrative is being spun by the mainstream media.
With this idea driving our hypothesis, we theorized that bettors would overvalue WNBA teams who made the playoffs in the previous season. Very few bettors intensely follow the WNBA and these individuals are likely to assume that the best teams from the previous season will continue to dominate in the current season. To test this theory, we opted to utilize our Bet Labs software.
Our research quickly found that teams who made the playoffs in the previous season did have a losing record (887-931 ATS) while teams who missed the playoffs had posted a winning record (1,198-1,154 ATS) the following season. Unfortunately, neither of these systems won at high enough rates to cover the standard -110 juice charged by sportsbooks.
However, this made us wonder: What would happen when a team who had missed the playoffs in the previous season was playing against a team who had made the playoffs in the previous season? The table below displays our results.
| Filter | Record (ATS) | Units Won | ROI |
|---|---|---|---|
| Team Missed Playoffs | 1198-1154 | -12.31 | -0.5% |
| Opponent Made Playoffs | 931-887 | -0.68 | 0.0% |
| Both | 396-352 | +24.91 | 3.3% |
We were amazed to see that non-playoff teams had actually posted a record of 396-352 ATS (+24.91 units) when they were playing a playoff team. Although neither filter was profitable on its own, the combination led to striking results.
Knowing that we had already developed a profitable system with a large sample size and consistent year-to-year results, we wanted to continue layering filters to improve our return on investment (ROI). We speculated that bettors would have even more difficulty backing a non-playoff team when they were favored against a playoff team, and that this contrarian viewpoint would greatly reduce our sample size while increasing our ROI.
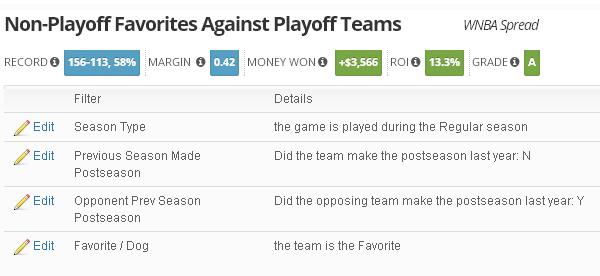
In fact, underdogs fitting this criteria have gone just 240-239 (-10.76 units lost) while favorites fitting this criteria have gone 156-113 ATS (+35.66 units won). It was expected that our return on investment would increase, but the units won jumping from +24.91 to +35.66 was a welcome surprise.
This system already fit each criterion we look for in a winning betting system, but there was one last trend we wanted to analyze. Historically, favorites with high totals and underdogs with low totals have both been undervalued in spread sports (football and basketball). Since our system now focused solely on favorites, we wanted to see how adjusting the closing total range would impact our profits.
The table below displays how our system has performed at various data points:
| Closing O/U | Record | Units Won | ROI |
|---|---|---|---|
| All | 156-113 | +35.66 | 13.3% |
| 146+ | 132-91 | +34.82 | 15.6% |
| 152+ | 82-53 | +25.33 | 18.8% |
| 158+ | 60-22 | +35.22 | 43.0% |
| 164+ | 38-13 | +23.10 | 45.3% |
Our research once again reflects a direct correlation between higher closing totals and the performance of favorites. This system’s return on investment steadily climbs as we increase the over/under and, although games with a total of at least 164 produces the highest ROI, our sweet spot is when the total closes at 158 or higher.
Since 2008, non-playoff teams have gone 60-22 ATS with +35.22 units won and a ridiculous 43% ROI when they’re favored against a playoff team and the closing total is at least 158. At the time of publication, this system had produced a 1-0 ATS record during the 2015 campaign and we will continue to update our record throughout the season.
We always preach that bettors should use their hand to cover the team names and instead place bets based on what the numbers indicate, but why stop there? Try covering the league name as well and start making money betting on the WNBA.
Bet Labs users can receive all current game matches by copying this system from our Bet Labs Think Tank. Sportsbook Insider customers can also track the latest odds and public betting trends by adding the WNBA to their live odds page.
Have any questions for the staff at Sports Insights? Utilize our live chat to speak with a customer service representative or e-mail us at help@sportsinsights.com.
David Solar is the Content Manager for Sports Insights and can be reached directly at David@sportsinsights.com.
No Comments