What Can a Baseball Team’s Performance the Previous Season Tell Us About Their Future Success?
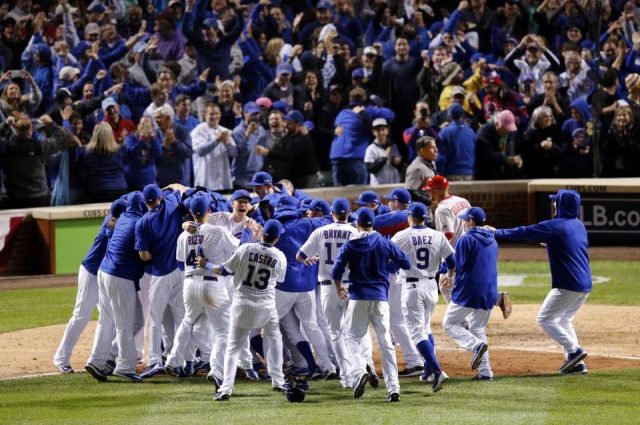
The Cubs were dynamite last season. They were dominant all season long and ended up breaking their World Series curse in one of the wildest baseball games anyone will ever see. They’re the unanimous favorite to have the most wins and repeat this season, but does that mean you should be frequently betting on them throughout the season?
This article contains several tables showing how the teams in the World Series did that season and the following season. It also shows how a gambler would do if they faded those teams the following season. Further down, I took a look at the best and worst teams from a gambling perspective and how one would do if they bet on or faded those teams the following year.
World Series Teams
| Year | World Series Champ | Record | Units | World Series Loser | Record | Units |
|---|---|---|---|---|---|---|
| 2005 | Chicago White Sox | 99-63* | +22.7 | Houston Astros | 89-73 | +7.4 |
| 2006 | St. Louis Cardinals | 83-78 | -17.3 | Detroit Tigers | 95-67 | +11.6 |
| 2007 | Boston Red Sox | 96-66 | +5.0 | Colorado Rockies | 90-73 | +24.8* |
| 2008 | Philadelphia Phillies | 91-71 | +3.0 | Tampa Bay Rays | 97-65 | +18.2 |
| 2009 | New York Yankees | 103-59 | +9.8 | Philadelphia Phillies | 93-69 | +7.4 |
| 2010 | San Francisco Giants | 92-70 | +10.3 | Texas Rangers | 90-72 | +0.9 |
| 2011 | St. Louis Cardinals | 90-72 | +4.2 | Texas Rangers | 96-66 | +8.5 |
| 2012 | San Francisco Giants | 94-68 | +15.1 | Detroit Tigers | 88-74 | -8.4 |
| 2013 | Boston Red Sox | 97-65 | +11.8 | St. Louis Cardinals | 97-65 | +9.2 |
| 2014 | San Francisco Giants | 88-74 | +2.2 | Kansas City Royals | 89-73 | +7.0 |
| 2015 | Kansas City Royals | 95-67 | +20.9 | New York Mets | 90-72 | +2.4 |
| 2016 | Chicago Cubs | 103-58 | +1.6 | Cleveland Indians | 94-67 | +2.7 |
| Total | 1131-811 (58.2%) | +89.3 (4.6% ROI) | 1108-836 (57.0%) | +91.7 (4.7% ROI) |
*Most profitable team that season
As you can see, all World Series teams are not made equally. It is clear that bookmakers did not expect the Royals to follow up their 2014 World Series appearance, as they were up over 20 units when they won in 2015. The 2006 Cardinals clearly underperformed in the regular season, but were still able to bring home the trophy.
Last season featured two of the least profitable teams in our database to make the World Series. Despite winning 103 games, betting $100 on the Cubs every game last season would have only netted about $160. This is because the books knew the Cubs were very good AND they knew that the public would be all over the Cubs essentially every night, and they were right.
The Cubs closed as underdogs just 12 times last season, winning 4 of those contests. On the other end of the spectrum, they went 20-5 when they closed at -250 or higher. In other words, they were twice as likely to be favored by -250 than to be an underdog. Also, they received less than 50% of bets just 11 times. Even though these public bettors were winning about 2/3 of the time, they weren’t really making a profit. Expect more of the same this season.
World Series Teams the Following Year
| Year | Reigning WS Champ | Record | Units | Reigning WS Loser | Record | Units |
|---|---|---|---|---|---|---|
| 2005 | Boston Red Sox | 95-67 | +3.9 | St. Louis Cardinals | 100-62 | +7.6 |
| 2006 | Chicago White Sox | 90-72 | -1.0 | Houston Astros | 82-80 | -9.8 |
| 2007 | St. Louis Cardinals | 78-84 | -2.7 | Detroit Tigers | 88-74 | +2.8 |
| 2008 | Boston Red Sox | 95-67 | +5.4 | Colorado Rockies | 74-88 | -16.6 |
| 2009 | Philadelphia Phillies | 93-69 | +7.4 | Tampa Bay Rays | 84-78 | -10.6 |
| 2010 | New York Yankees | 95-67 | -7.0 | Philadelphia Phillies | 97-65 | +11.3 |
| 2011 | San Francisco Giants | 86-76 | -2.4 | Texas Rangers | 96-66 | +8.5 |
| 2012 | St. Louis Cardinals | 88-74 | -6.4 | Texas Rangers | 93-69 | -5.6 |
| 2013 | San Francisco Giants | 76-86 | -14.9 | Detroit Tigers | 93-69 | -9.4 |
| 2014 | Boston Red Sox | 71-91 | -21.1 | St. Louis Cardinals | 90-72 | +0.6 |
| 2015 | San Francisco Giants | 84-78 | +0.4 | Kansas City Royals | 95-67 | +20.9 |
| 2016 | Kansas City Royals | 81-81 | -1.9 | New York Mets | 87-75 | -2.8 |
| Total | 1032-912 (53.1%) | -40.3 (-2.1% ROI) | 1079-865 (55.5%) | -3.1 (-0.1% ROI) |
As we can see, World Series Champions have not fared well in their following year. There have only been a couple of teams that accumulated over five units in the following year, with the Phillies in ’09 being the high water mark at +7.4 units. I don’t expect the Cubs to collapse like Red Sox or Giants from a few years back, but it would not be surprising to see them have a season like the 2010 Yankees. Despite winning 95 games, they finished seven units in the red.
Although the Royals have been the only team to lose the World Series and come back to win the following season, as a whole, the losers have had more success during their next season. Perhaps since they got so close, they are just that much more thirsty to win it. Their winning percentage, units, and ROI are all noticeably better than the teams that beat them, which is a good sign for the Indians.
Since these teams haven’t been profitable, perhaps fading them might be. Let’s take a look.
Fading World Series Teams the Following Year
| Year | Reigning WS Champ | Record | Units | Reigning WS Loser | Record | Units |
|---|---|---|---|---|---|---|
| 2005 | Boston Red Sox | 67-95 | -11.5 | St. Louis Cardinals | 62-100 | -17.3 |
| 2006 | Chicago White Sox | 72-90 | -3.0 | Houston Astros | 80-82 | +5.7 |
| 2007 | St. Louis Cardinals | 84-78 | +0.4 | Detroit Tigers | 74-88 | -5.7 |
| 2008 | Boston Red Sox | 67-95 | -16.3 | Colorado Rockies | 88-74 | +10.8 |
| 2009 | Philadelphia Phillies | 69-93 | -5.4 | Tampa Bay Rays | 78-84 | +5.3 |
| 2010 | New York Yankees | 67-95 | -1.2 | Philadelphia Phillies | 65-97 | -11.9 |
| 2011 | San Francisco Giants | 76-86 | -1.2 | Texas Rangers | 66-96 | -18.7 |
| 2012 | St. Louis Cardinals | 74-88 | -1.4 | Texas Rangers | 69-93 | -2.8 |
| 2013 | San Francisco Giants | 86-76 | +10.7 | Detroit Tigers | 69-93 | +3.0 |
| 2014 | Boston Red Sox | 91-71 | +18.4 | St. Louis Cardinals | 72-90 | -8.5 |
| 2015 | San Francisco Giants | 78-84 | -6.8 | Kansas City Royals | 67-95 | -25.2 |
| 2016 | Kansas City Royals | 81-81 | -11.8 | New York Mets | 75-87 | -1.0 |
| Total | 912-1032 (46.9%) | -29.1 (-1.5% ROI) | 865-1079 (44.5%) | -66.3 (-3.4% ROI) |
Still no long term profits, but the results are still pretty interesting. As we could’ve guessed from the previous table, fading the champs turns out to be better than fading the runner-up. However, it is tough to turn a profit when only winning about 47% or 45% of the time.
Instead of looking at World Series teams, what if we looked at the most and least profitable team each year from a gambling standpoint. Every year, there are teams that are undervalued by the books and end up winning at a much higher rate than expected. The same goes for the opposite. Below are the most and least profitable teams each year.
Most and Least Profitable Teams Each Year
| Year | Most Profitable Team | Record | Units | Least Profitable Team | Record | Units |
|---|---|---|---|---|---|---|
| 2005 | Chicago White Sox | 99-63 | +22.7 | Los Angeles Dodgers | 71-91 | -20.8 |
| 2006 | Oakland Athletics | 93-69 | +19.0 | Tampa Bay Rays | 61-101 | -20.2 |
| 2007 | Colorado Rockies | 90-73 | +24.8 | San Francisco Giants | 70-92 | -18.3 |
| 2008 | Los Angeles Angels | 100-62 | +26.6 | San Diego Padres | 62-100 | -33.1 |
| 2009 | Los Angeles Angels | 97-65 | +24.3 | Cleveland Indians | 65-97 | -27.6 |
| 2010 | San Diego Padres | 90-72 | +17.0 | Seattle Mariners | 61-101 | -34.7 |
| 2011 | Arizona Diamondbacks | 94-68 | +24.1 | Houston Astros | 56-106 | -33.0 |
| 2012 | Baltimore Orioles | 93-69 | +37.0 | Houston Astros | 55-107 | -31.5 |
| 2013 | Pittsburgh Pirates | 94-68 | +23.7 | Chicago White Sox | 63-99 | -30.1 |
| 2014 | Baltimore Orioles | 96-66 | +31.9 | Arizona Diamondbacks | 64-98 | -28.5 |
| 2015 | Texas Rangers | 88-74 | +27.4 | Cincinnati Reds | 64-98 | -29.8 |
| 2016 | Texas Rangers | 95-67 | +27.7 | Minnesota Twins | 59-103 | -28.2 |
| Total | 1129-816 (58.0%) | +306.2 (15.7% ROI) | 751-1193 (38.6%) | -335.8 (-17.3% ROI) |
None of the popular teams like the Yankees, Red Sox, Cubs, or Dodgers find themselves on the list of the most profitable teams. This is because books are going to shade those lines because they know public bettors will be on them.
There were a couple instances of a team repeating as the most profitable team of the year, including last year’s Rangers team. They were able to do that by going 36-11 in one run games, the best mark in the history in baseball. They only outscored their opponents by eight runs last season, which would point to them being around a .500 team rather than a 95-win team. I don’t expect them to three-peat this year.
The least profitable teams are, for the most part, absolute trainwrecks. Could they redeem themselves the next season?
Most and Least Profitable Teams Following Year
| Year | Most Profitable Team | Record | Units | Least Profitable Team | Record | Units |
|---|---|---|---|---|---|---|
| 2006 | Chicago White Sox | 90-72 | -1 | Los Angeles Dodgers | 88-74 | +5.1 |
| 2007 | Oakland Athletics | 76-86 | -10.8 | Tampa Bay Rays | 65-97 | -15.0 |
| 2008 | Colorado Rockies | 74-88 | -16.6 | San Francisco Giants | 72-90 | -6.2 |
| 2009 | Los Angeles Angels | 97-65 | +24.6 | San Diego Padres | 75-87 | +3.8 |
| 2010 | Los Angeles Angels | 80-82 | -4.1 | Cleveland Indians | 69-93 | -2.6 |
| 2011 | San Diego Padres | 71-91 | -12.0 | Seattle Mariners | 67-95 | -21.4 |
| 2012 | Arizona Diamondbacks | 81-81 | -8.6 | Houston Astros | 55-107 | -31.5 |
| 2013 | Baltimore Orioles | 85-77 | +2.7 | Houston Astros | 51-111 | -24.7 |
| 2014 | Pittsburgh Pirates | 88-74 | +1.0 | Chicago White Sox | 73-89 | -1.6 |
| 2015 | Baltimore Orioles | 81-81 | -4.0 | Arizona Diamondbacks | 79-83 | -0.1 |
| 2016 | Texas Rangers | 95-67 | +27.7 | Cincinnati Reds | 68-94 | -8.6 |
| Total | 918-864 (51.5%) | -1.1 (-0.1% ROI) | 762-1020 (42.8%) | -102.8 (-5.8% ROI) |
No…they couldn’t. One might think that since they are so bad, they might catch the books off guard and do surprisingly well the next year. However, only one team bounced back to have a winning record and good chunk of them still couldn’t reach 70 wins the following season.
There aren’t any expectations for the Twinkies this upcoming season — good ones at least. They probably aren’t going to be the 2011-2013 Astros, but they’re not going to be in any pennant races soon, either.
Now, what if we fade these teams?
Fading Most and Least Profitable Teams Following Year
| Year | Most Profitable Team | Record | Units | Least Profitable Team | Record | Units |
|---|---|---|---|---|---|---|
| 2006 | Chicago White Sox | 72-90 | -3.0 | Los Angeles Dodgers | 74-88 | -10.5 |
| 2007 | Oakland Athletics | 86-76 | +10.4 | Tampa Bay Rays | 97-65 | +9.4 |
| 2008 | Colorado Rockies | 88-74 | +10.8 | San Francisco Giants | 90-72 | -0.6 |
| 2009 | Los Angeles Angels | 65-97 | -22.0 | San Diego Padres | 87-75 | -8.2 |
| 2010 | Los Angeles Angels | 82-80 | +2.8 | Cleveland Indians | 93-69 | +1.0 |
| 2011 | San Diego Padres | 91-71 | +6.5 | Seattle Mariners | 95-67 | +11.9 |
| 2012 | Arizona Diamondbacks | 81-81 | +6.0 | Houston Astros | 107-55 | +11.5 |
| 2013 | Baltimore Orioles | 77-85 | -5.3 | Houston Astros | 111-51 | +11.7 |
| 2014 | Pittsburgh Pirates | 74-88 | -13.6 | Chicago White Sox | 89-73 | -2.4 |
| 2015 | Baltimore Orioles | 81-81 | -1.6 | Arizona Diamondbacks | 83-79 | -8.0 |
| 2016 | Texas Rangers | 67-95 | -30.8 | Cincinnati Reds | 94-68 | -4.1 |
| Total | 864-918 (48.5%) | -39.8 (-2.2% ROI) | 1020-762 (57.2%) | +11.7 (0.7% ROI) |
Ah, look. A positive sum! Nothing to bet the house on, but fading the worst teams has yielded a small profit over the past decade. This is largely in part to the aforementioned Astros abominations, but nevertheless a profit. The thing is, that small ROI is coming from a really high winning percentage for baseball. It is tough to win that often even if you are always taking the best teams or fading the worst ones.
Fading the best teams would look a lot better if it weren’t for last year’s Rangers team and the 2009 Angels squad, but still not a great strategy.
Unfortunately, it doesn’t appear that there are any magic shortcuts to win money based on a team’s performance the previous season. I was hoping one of these tables would spit out a reliable and relatively profitable trend that we could keep our eye on going into the season, but evidently, sportsbooks are smart. Who knew?
Looking to track the latest MLB odds, trends and futures throughout the baseball season? Make sure to bookmark our free MLB odds page.
If you have any thoughts or questions, feel free to reach out to the Sports Insights staff by utilizing our live chat feature, commenting below, or emailing us at help@sportsinsights.com.
No Comments