NFL Key Number Analysis for Over/Under Bettors
Earlier this week I examined the significance of key numbers for spread bettors by looking at the most common margins of victory over the past thirteen NFL seasons. Although these key numbers aren’t as critical for the over/under, I wanted to break down the most common totals (over/under) and see whether scoring was increasing league-wide. Moreover, I wanted to know whether scoring and totals were increasing at the same level.
As suspected, both scoring and totals have steadily increased over the past decade. Since the start of the 2003 season, the average total has increased by 9.8% while the average combined score increased by 8.8%. The biggest scoring increase came during the 2007 season, which is also the second most profitable “over” season in our database.
The table below compares the average closing total at Pinnacle with the average combined score in each of the past thirteen seasons.
NFL Totals vs. Actual Points Scored
| Season | Average O/U | Average Points | Over Record |
|---|---|---|---|
| 2015-16 | 45.05 | 45.46 | 124-138 |
| 2014-15 | 46.05 | 45.24 | 124-140 |
| 2013-14 | 45.45 | 46.87 | 138-126 |
| 2012-13 | 44.71 | 45.78 | 133-132 |
| 2011-12 | 43.69 | 44.49 | 133-131 |
| 2010-11 | 42.74 | 44.32 | 147-115 |
| 2009-10 | 42.83 | 43.16 | 125-137 |
| 2008-09 | 42.34 | 44.03 | 130-127 |
| 2007-08 | 41.53 | 43.39 | 141-119 |
| 2006-07 | 40.53 | 41.51 | 128-125 |
| 2005-06 | 40.92 | 41.10 | 127-138 |
| 2004-05 | 42.10 | 43.15 | 129-134 |
| 2003-04 | 41.02 | 41.79 | 126-138 |
| Total | 43.00 | 43.87 | 1705-1700 |
The lowest recorded closing total in our database was 30, which has occurred four times. The highest recorded closing total (60) came in a game between the Oakland Raiders and Kansas City Chiefs back on Christmas Day in 2004. For what it’s worth, there have been 520 games (14.98%) with fewer than 30 points scored and 447 games (12.88%) with more than 60 combined points.
Readers may also be interested to know that the highest scoring game in our database took place on November 28, 2004, when the Cincinnati Bengals defeated the Cleveland Browns by the final score of 58-48. The closing total for that game was 37.5, which means that both teams single-handedly crushed the over. It’s also worth noting that it’s only the second highest scoring game in league history. Back in 1966, the Washington Redskins beat the New York Giants, 72-41.
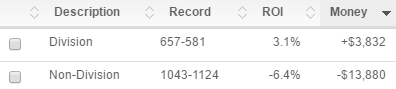
Despite these record-setting scores occurring in rivalry games, my research has found that familiarity between teams disproportionately benefits the defense. In other words, bettors should gravitate towards the under in divisional rivalries and the over in non-conference games.
Under Record Since 2003
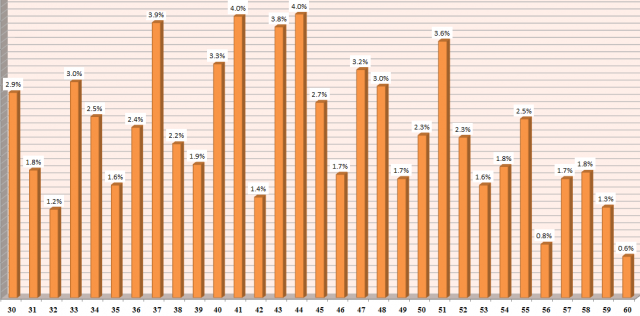
It may seem obvious to some bettors, but it has been more profitable to take the under in games with higher totals (44 or more), while it’s been preferable to take the over in games with low totals (41 or less). Those two betting thresholds are particularly interesting because they represent the most common final scores. Since 2003, 3.98% of all regular season and playoff games have ended with a combined score of 44. Similarly, 3.95% of all games have concluded with a combined score of 41.
You may be surprised to see that 41 and 44 are atop this list, but there are so many common NFL scores that can land on those numbers. A combined score of 41 could represent a final score of 21-20, 24-17, 27-14, 28-13 and many others. A combined score of 44 could represent other common scores like 24-20 and 27-17.
Scott Cooley, an Odds Consultant for the market-setting Bookmaker.eu, confirmed these findings. “As far as key numbers, the two that are somewhat on the radar are 41 and 44, although we are not hesitant to move off of those numbers, nor do we charge a juice to do so if you’re buying points.”
When bettors are buying the hook on key spread numbers like 3 or 7, most sportsbooks charge an additional 20-25 cents. Since sportsbooks’ key numbers aren’t as significant for the over/under, they do not charge additional juice nor do they hesitate to adjust the total.
The table below displays the most common combined scores since the start of the 2003 NFL season.
Key Numbers (2003-Present)
| Points | Occurences | Frequency |
|---|---|---|
| 44 | 138 | 3.98% |
| 41 | 137 | 3.95% |
| 37 | 134 | 3.86% |
| 43 | 132 | 3.80% |
| 51 | 125 | 3.60% |
| 40 | 114 | 3.28% |
| 47 | 111 | 3.20% |
| 33 | 105 | 3.03% |
| 48 | 103 | 2.97% |
| 30 | 100 | 2.88% |
| 45 | 95 | 2.74% |
| 34 | 88 | 2.54% |
| 55 | 87 | 2.51% |
| 36 | 83 | 2.39% |
| 27 | 81 | 2.33% |
| 50 | 79 | 2.28% |
| 23 | 78 | 2.25% |
| 52 | 78 | 2.25% |
| 38 | 75 | 2.16% |
| 39 | 65 | 1.87% |
| 54 | 64 | 1.84% |
| 31 | 62 | 1.79% |
| 58 | 61 | 1.76% |
| 46 | 60 | 1.73% |
| 26 | 59 | 1.70% |
| 29 | 58 | 1.67% |
| 57 | 58 | 1.67% |
| 49 | 58 | 1.67% |
| 61 | 56 | 1.61% |
| 53 | 55 | 1.58% |
| 35 | 55 | 1.58% |
| 42 | 49 | 1.41% |
| 62 | 48 | 1.38% |
| 65 | 45 | 1.30% |
| 59 | 44 | 1.27% |
| 32 | 43 | 1.24% |
| 69 | 35 | 1.01% |
| 64 | 32 | 0.92% |
| 66 | 31 | 0.89% |
| 22 | 31 | 0.89% |
| 16 | 29 | 0.84% |
| 24 | 28 | 0.81% |
| 19 | 27 | 0.78% |
| 56 | 26 | 0.75% |
| 73 | 23 | 0.66% |
| 20 | 23 | 0.66% |
| 63 | 22 | 0.63% |
| 28 | 22 | 0.63% |
| 60 | 20 | 0.58% |
| 68 | 20 | 0.58% |
| 25 | 19 | 0.55% |
| 21 | 15 | 0.43% |
| 72 | 15 | 0.43% |
| 71 | 15 | 0.43% |
| 67 | 15 | 0.43% |
| 13 | 14 | 0.40% |
| 75 | 14 | 0.40% |
| 17 | 11 | 0.32% |
| 70 | 11 | 0.32% |
| 76 | 9 | 0.26% |
| 80 | 8 | 0.23% |
| 15 | 7 | 0.20% |
| 74 | 6 | 0.17% |
| 79 | 6 | 0.17% |
| 9 | 5 | 0.14% |
| 77 | 5 | 0.14% |
| 85 | 5 | 0.14% |
| 12 | 4 | 0.12% |
| 86 | 3 | 0.09% |
| 83 | 3 | 0.09% |
| 87 | 3 | 0.09% |
| 10 | 3 | 0.09% |
| 82 | 3 | 0.09% |
| 78 | 3 | 0.09% |
| 96 | 2 | 0.06% |
| 89 | 2 | 0.06% |
| 18 | 2 | 0.06% |
| 106 | 1 | 0.03% |
| 81 | 1 | 0.03% |
| 84 | 1 | 0.03% |
| 99 | 1 | 0.03% |
| 90 | 1 | 0.03% |
| 91 | 1 | 0.03% |
| 6 | 1 | 0.03% |
| 101 | 1 | 0.03% |
| 14 | 1 | 0.03% |
| 3 | 1 | 0.03% |
| 8 | 1 | 0.03% |
| 0 | 0 | 0.00% |
| 1 | 0 | 0.00% |
| 88 | 0 | 0.00% |
| 92 | 0 | 0.00% |
| 93 | 0 | 0.00% |
| 94 | 0 | 0.00% |
| 95 | 0 | 0.00% |
| 97 | 0 | 0.00% |
| 98 | 0 | 0.00% |
| 100 | 0 | 0.00% |
| 2 | 0 | 0.00% |
| 103 | 0 | 0.00% |
| 11 | 0 | 0.00% |
| 104 | 0 | 0.00% |
| 105 | 0 | 0.00% |
| 7 | 0 | 0.00% |
| 5 | 0 | 0.00% |
| 4 | 0 | 0.00% |
| 102 | 0 | 0.00% |
One interesting takeaway is the rising popularity of totals in the fifties. Since 2003, roughly 8% of all games have closed with a total of 50 or higher with more than half of those games taking place in the last four seasons.
When I ran this analysis in December 2013, the most common data point was 37. However, scoring has been increasing league-wide and there have been fewer games finishing with final scores of 20-17, 24-13 or 27-10. Conversely, this uptick in scoring has caused 51 to move from the seventh most common data point to the fifth most common.
“It’s difficult to project what type of scoring we will see this year,” said Cooley. “The perception is that the league has become a pass-happy league with a premium on offensive players’ safety, so therefore we will see an increase in scoring opportunities. And to some extent, I do think that is true.”
Based on these changing trends, I decided to examine the most common combined scores over the past two seasons (2014 and 2015).
Key Numbers (2014-Present)
| Points | Occurences | Frequency |
|---|---|---|
| 43 | 23 | 4.31% |
| 44 | 20 | 3.75% |
| 37 | 20 | 3.75% |
| 41 | 19 | 3.56% |
| 47 | 19 | 3.56% |
| 55 | 19 | 3.56% |
| 30 | 18 | 3.37% |
| 51 | 18 | 3.37% |
| 34 | 18 | 3.37% |
| 36 | 16 | 3.00% |
| 50 | 15 | 2.81% |
| 40 | 14 | 2.62% |
| 54 | 13 | 2.43% |
| 61 | 13 | 2.43% |
| 26 | 13 | 2.43% |
| 45 | 12 | 2.25% |
| 39 | 12 | 2.25% |
| 52 | 12 | 2.25% |
| 33 | 11 | 2.06% |
| 46 | 11 | 2.06% |
| 32 | 10 | 1.87% |
| 27 | 10 | 1.87% |
| 38 | 10 | 1.87% |
| 49 | 10 | 1.87% |
| 48 | 10 | 1.87% |
| 65 | 9 | 1.69% |
| 66 | 9 | 1.69% |
| 53 | 9 | 1.69% |
| 57 | 8 | 1.50% |
| 42 | 8 | 1.50% |
| 35 | 8 | 1.50% |
| 59 | 7 | 1.31% |
| 60 | 7 | 1.31% |
| 23 | 7 | 1.31% |
| 31 | 6 | 1.12% |
| 69 | 6 | 1.12% |
| 62 | 6 | 1.12% |
| 67 | 6 | 1.12% |
| 29 | 6 | 1.12% |
| 56 | 6 | 1.12% |
| 71 | 5 | 0.94% |
| 22 | 5 | 0.94% |
| 73 | 4 | 0.75% |
| 64 | 4 | 0.75% |
| 20 | 4 | 0.75% |
| 63 | 3 | 0.56% |
| 58 | 3 | 0.56% |
| 68 | 3 | 0.56% |
| 28 | 3 | 0.56% |
| 70 | 3 | 0.56% |
| 18 | 2 | 0.37% |
| 24 | 2 | 0.37% |
| 16 | 2 | 0.37% |
| 72 | 2 | 0.37% |
| 19 | 2 | 0.37% |
| 74 | 2 | 0.37% |
| 25 | 2 | 0.37% |
| 85 | 1 | 0.19% |
| 75 | 1 | 0.19% |
| 76 | 1 | 0.19% |
| 101 | 1 | 0.19% |
| 17 | 1 | 0.19% |
| 79 | 1 | 0.19% |
| 80 | 1 | 0.19% |
| 81 | 1 | 0.19% |
| 13 | 1 | 0.19% |
| 77 | 0 | 0.00% |
| 14 | 0 | 0.00% |
| 78 | 0 | 0.00% |
| 82 | 0 | 0.00% |
| 83 | 0 | 0.00% |
| 84 | 0 | 0.00% |
| 86 | 0 | 0.00% |
| 87 | 0 | 0.00% |
| 88 | 0 | 0.00% |
| 89 | 0 | 0.00% |
| 90 | 0 | 0.00% |
| 15 | 0 | 0.00% |
| 92 | 0 | 0.00% |
| 93 | 0 | 0.00% |
| 94 | 0 | 0.00% |
| 95 | 0 | 0.00% |
| 96 | 0 | 0.00% |
| 21 | 0 | 0.00% |
| 97 | 0 | 0.00% |
| 98 | 0 | 0.00% |
| 99 | 0 | 0.00% |
| 100 | 0 | 0.00% |
| 91 | 0 | 0.00% |
One of the most obvious takeaways is the increasing popularity of 43. Last season the league’s competition committee voted to move the extra point from the 2-yard line to the 15-yard line, which caused an uptick in missed extra points. It’s tough to draw conclusions based on such a small sample, but it will be interesting to see whether this trend continues in 2016.
My analysis also found that Week 1 totals have been slightly higher than late season totals, and that appears to be the case once again this season. According to Cooley, there’s good reason for that trend. “In my experience, the offenses are usually ahead of the defenses early in the year. So, without looking at any concrete numbers, I do think the games tend to produce more points early in the season.”
I wanted to verify whether this number was accurate, so I examined several trends for Week 1 unders. As it turns out, the Week 1 under has actually gone 112-94 (54.37%) since the start of the 2003 season which seems to contradict Cooley’s assumption. Additionally, the average Week 1 total (42.54) has been slightly lower than the full-season average (43.00).
Full Season vs. Week 1 Over/Unders
| Season | Full Season O/U | Week 1 O/U | Week 1 PPG | Under Record |
|---|---|---|---|---|
| 2003 | 41.02 | 41.9375 | 40.3125 | 9-7 |
| 2004 | 42.10 | 41.875 | 38.8125 | 9-7 |
| 2005 | 40.92 | 41.9688 | 38.4375 | 9-7 |
| 2006 | 40.53 | 39.6563 | 34.5625 | 12-4 |
| 2007 | 41.53 | 40.75 | 38 | 11-5 |
| 2008 | 42.34 | 40.9688 | 40.0625 | 9-7 |
| 2009 | 42.83 | 42.4688 | 40.5625 | 8-8 |
| 2010 | 42.74 | 41.6875 | 36.5625 | 11-4 |
| 2011 | 43.69 | 41.1563 | 47 | 3-12 |
| 2012 | 44.71 | 43.9375 | 49.4375 | 7-9 |
| 2013 | 45.45 | 45.5938 | 46.375 | 8-8 |
| 2014 | 46.05 | 45.625 | 44.75 | 9-7 |
| 2015 | 45.05 | 45.3438 | 45.25 | 7-9 |
Getting the best of key numbers on the total isn’t as valuable as it is on the spread, but it’s still essential for maximizing your winnings over the long haul. That’s one of the major reasons we advocate setting up multiple accounts and shopping for the best line before placing a wager. Nobody wants to push Under 41 when you could have found a sportsbook offering 41.5.
There are a number of factors that will impact the total and, contrary to popular opinion; it’s not simply a formula involving each team’s offensive and defensive output. Public betting, injuries and perhaps most importantly — weather conditions. However, bettors may be surprised to learn that cold temperatures don’t lead to low scoring games. In fact, the exact opposite is true with overs providing value in games with freezing temperatures. If anything, strong wind speeds are the biggest factor contributing to value on the under.
Looking to track the latest odds, public betting trends and injury updates? Make sure to visit our free NFL odds page. Want to track sharp money indicators and utilize unique tools like our line watcher and line predictor? Try Sportsbook Insider Pro today by signing up for a 4-day trial.
Have any questions for the staff at Sports Insights? Utilize our live chat to speak with a customer service representative or e-mail us at help@sportsinsights.com.
No Comments