Do American League Teams Still Hold the Edge in Interleague Play?
Since being introduced prior to the 1997 MLB season, there have been mixed feelings about interleague play. The increased ratings indicate fans love seeing unique matchups and rivalries that previously took place exclusively during the World Series. New Yorkers love watching the Mets square off against the Yankees, while the divide between the North and South side of Chicago is on display when the Cubs play the White Sox. Interleague play creates exciting drama, but it’s not without drawbacks.
[ Schedule a one-on-one demo & we’ll add 4 free days onto your Sportsbook Insider trial ]
Baseball purists argue that there’s an unfair advantage based on ballpark since American League pitchers don’t take batting practice and National League team’s rarely have the bench depth to install an above average designated hitter. These same individuals dislike the decreased number of divisional rivalry games and believe that interleague play eliminates the mystique of the World Series and All-Star Game.
It’s clear that American League teams have dominated their non-conference opposition, posting a 52.7% win rate over the past two decades. The table below displays the record of AL teams during interleague play since the start of the 1997 season.
| Year | Games | AL Wins | NL Wins | AL Win Rate |
|---|---|---|---|---|
| 1997 | 214 | 97 | 117 | 45.33% |
| 1998 | 224 | 114 | 110 | 50.89% |
| 1999 | 251 | 116 | 135 | 46.22% |
| 2000 | 251 | 136 | 115 | 54.18% |
| 2001 | 252 | 132 | 120 | 52.38% |
| 2002 | 252 | 123 | 129 | 48.81% |
| 2003 | 252 | 115 | 137 | 45.63% |
| 2004 | 252 | 127 | 125 | 50.40% |
| 2005 | 252 | 136 | 116 | 53.97% |
| 2006 | 252 | 154 | 98 | 61.11% |
| 2007 | 252 | 137 | 115 | 54.37% |
| 2008 | 252 | 149 | 103 | 59.13% |
| 2009 | 252 | 138 | 114 | 54.76% |
| 2010 | 252 | 134 | 118 | 53.17% |
| 2011 | 252 | 131 | 121 | 51.98% |
| 2012 | 252 | 142 | 110 | 56.35% |
| 2013 | 300 | 154 | 146 | 51.33% |
| 2014 | 300 | 163 | 137 | 54.33% |
| 2015 | 300 | 167 | 133 | 55.67% |
| 2016 | 108 | 56 | 52 | 51.85% |
| Total | 4972 | 2621 | 2351 | 52.72% |
Following the Houston Astros’ move from the National League to the American League in 2013, there are now two equal 15-team leagues. That means at least one interleague series is occurring at all times throughout the season. With that in mind, I wanted to not only confirm that American League teams have an advantage over the National League, but examine whether this had provided an edge for bettors. I also wanted to determine whether that advantage is exacerbated in AL ballparks where both teams utilize a designated hitter.
My research found that, since the start of the 2005 season, AL teams have gone 1,672-1,371 (54.9%) with +127.91 units won and a 4.2% return on investment (ROI) in regular season games against NL opponents. It was also interesting to note that although their winning percentage was much higher at home (59.7%) than on the road (50.2%), the ROI is nearly identical (4.3% vs. 4.1% respectively).
[easy-tweet tweet=”Since ’05, AL teams have gone 1672-1371 (54.9%) with +127.9 units won during interleague play.” user=”SportsInsights”]
It was also fascinating to see that the seven most profitable teams in interleague play all reside in the American League. The Mets (98-96, +12.21 units) were the most profitable National League team in our database.
| Team | Record | Units won |
|---|---|---|
| Boston Red Sox | 138-75 | +32.79 |
| Los Angeles Angels | 129-90 | +23.14 |
| Kansas City Royals | 112-100 | +23.11 |
| Chicago White Sox | 120-90 | +20.89 |
| Detroit Tigers | 131-85 | +18.81 |
| Texas Rangers | 119-91 | +18.44 |
| Minnesota Twins | 115-99 | +14.50 |
The National League hasn’t won interleague play since 2003, but that doesn’t mean that bettors should be hammering every American League team. This season AL teams have gone 67-60 against NL opponents, but bettors would have lost -1.17 units in these games. In home games where most bettors would assume the advantage is greatest, that record shrinks to 29-31 with -10.62 units lost.
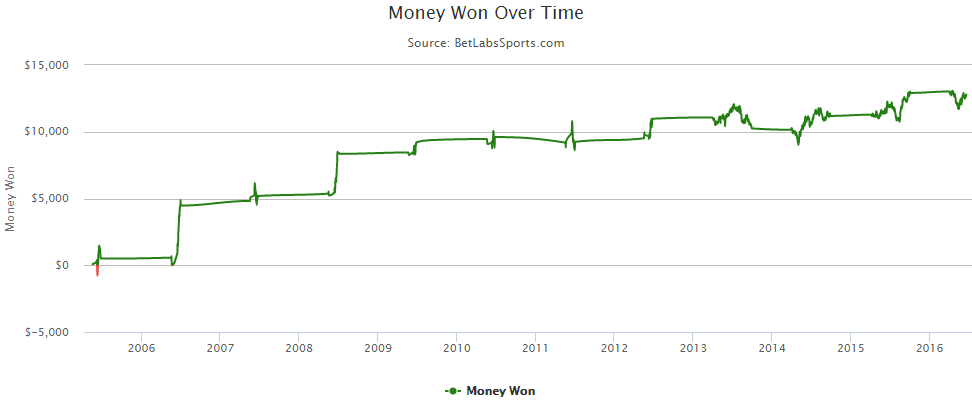
Between 2005 and 2012, American League teams produced a 5.4% ROI in interleague games. In the three-plus years since the Astros joined the AL, that figure has dropped to 1.8%. That shift can be easily seen in the results graph below.
I’m always looking to find an edge by exploiting public perception and, based on our public betting trends, it would appear that public bettors are becoming increasingly prone to taking AL teams during interleague play. Since 2005, AL teams have received a majority of moneyline bets at our contributing sportsbooks in 57.05% of all regular season games.
The table below displays the percentage of games in which the American League team received a majority of public bets.
| Year | AL Public | Total Games | Percentage |
|---|---|---|---|
| 2005 | 139 | 252 | 55.16% |
| 2006 | 160 | 252 | 63.49% |
| 2007 | 143 | 252 | 56.75% |
| 2008 | 167 | 252 | 66.27% |
| 2009 | 147 | 252 | 58.33% |
| 2010 | 125 | 252 | 49.60% |
| 2011 | 143 | 252 | 56.75% |
| 2012 | 143 | 252 | 56.75% |
| 2013 | 161 | 300 | 53.67% |
| 2014 | 175 | 300 | 58.33% |
| 2015 | 160 | 300 | 53.33% |
| 2016 | 73 | 108 | 67.59% |
Over the past eleven seasons, bettors have overwhelmingly gravitated towards American League teams but that tendency has reached its peak this season. At the time of publication, there had been 108 interleague games played and a majority of public bettors had taken the AL team in more than two-thirds of these games. In other words, AL teams are more popular now than ever before. But what happens when the public backs the National League team?
Since 2005, American League teams have posted a 4.2% ROI during interleague play but that number jumps to 6.6% when they’re receiving less than 50% of moneyline bets, 6.8% when they’re receiving less than 40% of moneyline bets and 8.3% when they’re receiving less than 30% of moneyline bets.
Those numbers look incredibly profitable at first glance, but recent history belies the truth. Contrarian AL teams don’t have the type of consistency that I look for when building data-driven betting systems.
American League teams receiving less than 30% of moneyline bets during interleague play, which has been the optimal threshold for betting against the public, have actually lost money in four of the past five seasons. There was a time that there was value taking contrarian AL teams during interleague play, but it seems like sportsbooks are now shading their lines to account for these trends.
To confirm that oddsmakers were adjusting their lines to account for an influx of money on AL teams I spoke with Scott Cooley, an Odds Consultant for the well-respected offshore sportsbook Bookmaker.eu. “We do shade them toward the AL a very small amount,” Cooley said regarding interleague play. “There is a perception that the AL is superior to the NL. This is likely because many of the high-profile, big-market teams reside in the AL, and the public perceives the lineups are more potent from top to bottom because of the designated hitter.”
The one surprise was that despite increased TV ratings, bettors aren’t necessarily compelled by interleague play. According to Cooley, “The volume of tickets is not increased for interleague games, in fact, it drops off a tick.” That was a fascinating development since my past research indicates that the value of betting against the public is directly tied to the number of bets placed on a game.
Fading National League teams during interleague play may no longer be as profitable as it was years ago, but that doesn’t mean that there’s no value whatsoever. In fact, I found that the closing total has a direct impact on moneyline value during interleague play. AL teams have produced a 4.9% ROI when the closing total is 7.5 or higher. What’s particularly compelling about that trend is that it hasn’t produced a losing season since 2005 (131-114, -0.39 units).
A National League team will typically use a position player as designated hitter, but that’s not usually a premier bat. A utility player simply can’t match the production of an American League DH. That helps explain why AL teams have fared better in games with high totals, since their lineups are better designed for high-scoring games. Conversely, NL teams have fared slightly better in low-scoring games where there’s more of a premium placed on pitching and defense.
Speaking of totals, it was interesting to find that these games have been comparatively low-scoring. Since 2005, the under has gone 1507-1403 (51.8%) during interleague play including a 760-695 record (52.2%) when the game was played in an AL stadium. Contrary to conventional wisdom, there’s actually more value taking the under in games featuring the designated hitter.
Although the under has been profitable over the past eleven seasons, the tides have been changing in recent years. Since the start of the 2014 season, the under has gone just 337-356 (48.6%) during interleague play including a 50-73 mark (40.7%) this year. That’s not to say that there’s suddenly value on the over, only that there’s no longer value on interleague unders.
We always encourage contrarian bettors to take unpopular viewpoints and buy on bad news in order to exploit lines that have been inflated based on public perception. It hasn’t been profitable betting on National League teams during interleague play but, much like Lady Gaga’s hair, that can change in a hurry. Sportsbooks are now shading their lines towards American League teams based on public perception, which means this could be an excellent opportunity to go against the grain and buy low on NL teams — especially in games with low totals.
This season has seen historically high levels of public support for AL teams during interleague play, and contrarian bettors can exploit this tendency by backing NL ball clubs. Although National League teams have a losing record during interleague play this season, it’s actually been second-best performance in our database. It’s also worth noting that during the 2016 season, NL teams have gone 11-5 (+5.06 units) when the closing total is 7 or less.
There’s no doubt that American League teams have had a significant advantage since the inception of interleague play, but public perception has caused oddsmakers to shade their lines to encourage action on their National League opposition. Betting on lines that have been artificially inflated based on popular sentiment is one of the hallmarks of a contrarian betting strategy.
Looking for the latest odds, injuries and public betting trends? Don’t forget to bookmark our free MLB odds page for all of your sports betting needs.
Have any questions for the staff at Sports Insights? Utilize our live chat to speak with a customer service representative or e-mail us at help@sportsinsights.com.
No Comments