Betting on NHL Totals: A Historical Narrative
When it comes to gambling on the four major pro sports in America, betting on NHL totals is unique. The NHL has gone through several distinct eras and in the current one, scoring is down.
Let’s take a trip down memory lane. Right around 1960, scoring was on the rise and NHL teams began to average around three goals per game. When the 70s came along, that number started to creep up in the mid-threes and when “The Great One”, Wayne Gretzky, entered the league, scoring was at an all time high. Between 1980 and 1985, teams were averaging right around four goals per game, which would put gambling totals around eight. However, some teams like Gretzky’s Oilers would have likely seen much higher totals. An average game for the 1983-84 Oilers had 9.5 goals. Nine and a half on average! While NHL gambling data from this era is hard to come by, you can be sure that some of these games had double-digit totals.
From that point on, scoring began to decline until the 2003-04 season, the year before the lockout. In that season teams averaged 2.57 goals per game, which was the lowest since the 1955-56 season — yikes! Much of the scoring decline was thanks to goaltenders switching from the stand-up style to the butterfly. On the left, you can see what an 80s goalie looked like, relying primarily on the inconsistent kick-save. On the right, you can see a modern-day goalie using the butterfly, which has helped the average save percentage increase from .875% in the mid-80s to .915% in recent years.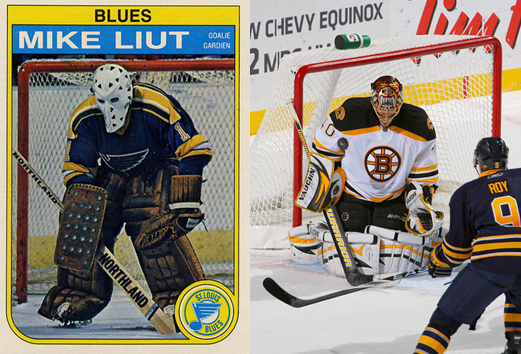
The league made several rule changes during the 2004 lockout to increase scoring, most notably taking away the two-line pass rule and adding the shootout to get rid of ties. As a result, goal scoring made a much needed return. And as luck would have it, that is where our NHL database begins.
In the 2005-06 season, teams averaged 3.08 goals per game, meaning the average game had just over six goals in it. Here is a look at how often each total occurred during that season:
| Over | Under | Push | Total Occurrences | |
|---|---|---|---|---|
| 7.5 | 2 | 1 | 0 | 3 |
| 7 | 23 | 35 | 42 | 100 |
| 6.5 | 240 | 244 | 0 | 484 |
| 6 | 213 | 241 | 78 | 532 |
| 5.5 | 69 | 70 | 0 | 139 |
| 5 | 7 | 5 | 12 | 24 |
As expected, 6 and 6.5 occurred the most by far. You can also see that these totals will push a fair amount of the time when they land on a whole number. This goal-scoring burst was short lived though, and books were quick to catch up with the trends. Although there wasn’t an extreme decline in scoring, the average game in the following year had 5.9 goals. Kiss those totals of 7 and 7.5 goodbye.
Late in the 2005-06 season, taking the under in these high totals became very profitable. Next season, they almost exclusively went under to such an extent that books never posted a total of seven again…at least up until this point.
Fast-forward a bit and you get to the current era. Since the 2010-11 season, teams have averaged somewhere between 2.7 and 2.8 goals per game each year. Double that and you get 5.5 goals per game, one of the two common totals in today’s age.
Since that 10-11 season, there has only been a total of 6 or 6.5 132 times, which is a far cry from the 1000 times it happened the year after the lockout. In fact, last season the total didn’t close that high one time. Not once!
If there are essentially only two totals that games land on now — 5 or 5.5 — how do the lines move? Juice, of course.
This season, the juice on totals has been anywhere between -169 and +152. On your basic football or basketball total, you’ll often see the juice between -120 and +100. Instead of going any higher, they’ll usually just move the total. With hockey, the total almost always stays the same. This season, the total itself has only fallen seven times from open to close and gone up 26 times. As of January 15th, there has been 650 games played this year so far, but the total itself has changed 33 times, which comes out to 5%. For comparison, during this past NFL season, the total stayed the same just 9% of the time.
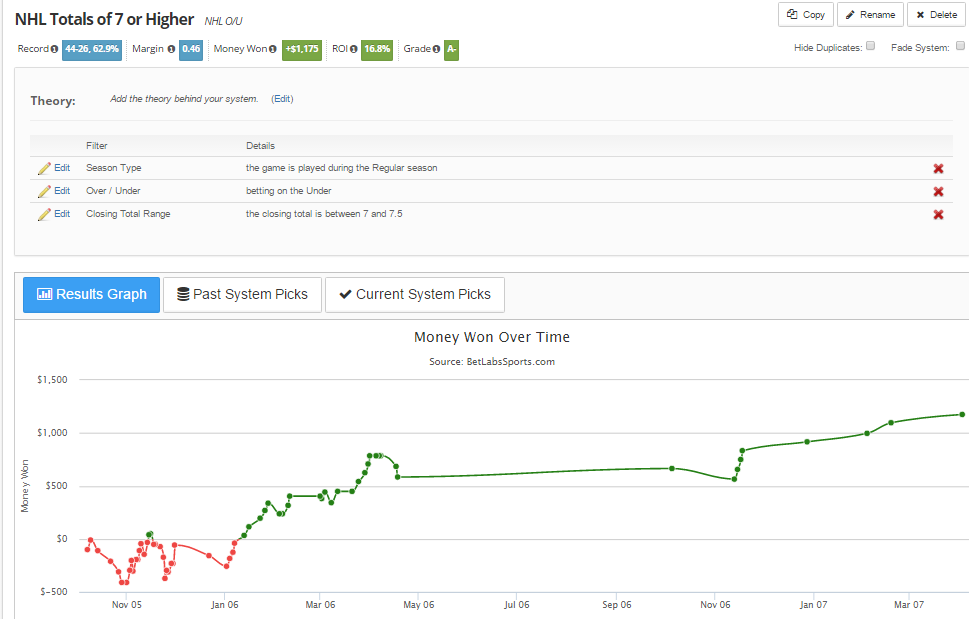
Since the totals aren’t going to move for the most part, you could bet solely based on the juice. Regardless of taking the over or under, here’s what the results would look like since the 2010-11 season.
| Wins | Losses | Units Won | ROI | |
|---|---|---|---|---|
| -193 to -101 | 4014 | 3489 | -170.9 | -2.3% |
| -193 to -140 | 508 | 334 | +11.9 | 1.4% |
| +100 to +173 | 2743 | 3268 | -123.6 | -2.1% |
| +130 to +173 | 259 | 401 | -50.5 | -7.6% |
Taking totals juiced at -100 or higher or +100 or higher resulted in a very similar ROI, but if you look to the extremes, you’ll see a large difference. Taking the heavily favored sides of -140 or higher resulted in a small profit, while taking the larger totals “dogs” of +130 or greater resulted in a very poor ROI.
This season, we’ve seen the occasional higher totals that were becoming more and more rare over the past few years.
| Over | Under | Push | Total Occurrences | |
|---|---|---|---|---|
| 6.5 | 1 | 2 | 0 | 3 |
| 6 | 1 | 3 | 0 | 4 |
| 5.5 | 145 | 177 | 0 | 322 |
| 5 | 124 | 107 | 90 | 321 |
There were four games in 2010-11 with 6.5 totals and then none until the three this season. If you like goals, that’s a good sign. Teams are averaging 2.75 goals per game this year, which is the highest since the average was 2.79 in the 10-11 season. If that number continues to climb closer to three, we will see a wider range of totals again, rather than just 5 and 5.5.
Something to keep an eye on in the future is whether or not the league decreases the size of the goalie equipment. This rule change was suggested last year and may be put into effect next season. Goaltenders seem to be getting taller and taller each season, led by Tampa Bay’s Ben Bishop at 6’7″. Considering the bulkiness of the pads, these goalies are taking up a huge percentage of the net just by standing/kneeling there. By streamlining their equipment, we’d certainly see goal numbers rise, but who knows by how much. Scoring in the NFL and NBA has consistently gone up in recent years so it’s about time that the NHL caught up.
To track lines and totals on NHL games, check our free NHL odds page.
If you have any thoughts or questions, feel free to reach out to the Sports Insights staff by utilizing our live chat feature, commenting below, or emailing us at help@sportsinsights.com.
No Comments