
April a Big Month for MLB Overs
Through the first month of the MLB season, we are starting to figure out what teams may be pleasant surprises and which may be disappointments. But one betting trend that caught our eye at Sports Insights was the number of games that are going over the total. So far this season, overs are 172-136 using Pinnacle’s closing line data from our Bet Labs Software. This 55.8% win percentage has produced +26.5 units won and a 8.6% ROI for anyone crazy enough to bet every over this season.
Bettors may be surprised to learn that this is the third straight April that MLB overs have been profitable. Is there an underlying reason that these early-season games are going over? Are bettors overly weighting colder temperatures? Random luck? These are all viable hypotheses but the actual answer may be the most simple.
| Season | Runs Per Game (April) | Average Total (April) |
|---|---|---|
| 2015 | 8.6 | 7.6 |
| 2014 | 8.4 | 7.8 |
| 2013 | 8.6 | 7.9 |
| 2012 | 8.4 | 7.9 |
| 2011 | 8.6 | 8.2 |
The runs scored per game over the last 5 seasons has remained relatively consistent, fluctuating between 4.2 and 4.3 runs per game per team. The average totals over that same span have continued to drop. The number of runs remaining static plus the lowering of the totals is going to end with more totals going over the projected total.
The obvious next question is: will this trend continue? Let’s take a look at the data. Over the last 5 MLB seasons, here are the results for betting every over broken down by each month.
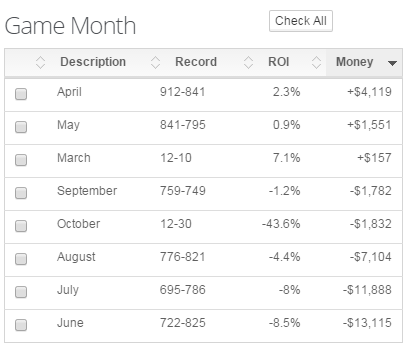
This data is contrary to the popular belief that offenses heat up in the summer months as those have been the worst months to bet overs. While it’s not realistic to bet every single total in a month, this data does provide some very interesting context while navigating through the lengthy baseball season.
No Comments