Win 57.1% ATS by Fading Large Public NFL Favorites
With the release of our Bet Labs software, we decided to analyze eight years worth of archived NFL data in order to find profitable betting systems and optimum betting percentage levels for Betting Against the Public.
Using Bet Labs, we first looked at how well NFL underdogs have done in regular season games since the beginning of the 2004 season. By applying the Underdog Filter, we quickly found out that dogs have produced a winning percentage of 50.3% ATS (Against the Spread) over the past eight years. While underdogs cover the spread more often than favorites do, this alone is not enough to produce a profit for NFL bettors.
Since the 20% level has been historically successful in baseball, we wanted to see if this betting percentage level was also profitable when applied to NFL underdogs.
Spoiler Alert: It was.
Building on our existing Bet Labs system of all NFL underdogs, we added the Spread Betting Percentage filter to include only games where one team received 20% or fewer of spread bets. With the simple addition of this filter, our ATS win rate jumped from 50.3% to 57.1%.
The table below includes ATS results for all NFL regular season games since the start of the 2004 season (over 2,100 total games).
| Betting System | Win % | Units Won | ROI |
| All Underdogs | 50.3% | -39.86 | -1.8% |
| 20% Underdogs | 57.1% | +16.56 | 11.3% |
* Pinnacle’s closing lines were used to determine ATS records and Units won.
It’s also important to note that the sample size for this system is 147 games, which breaks down to a very bankroll friendly 18 plays per season.
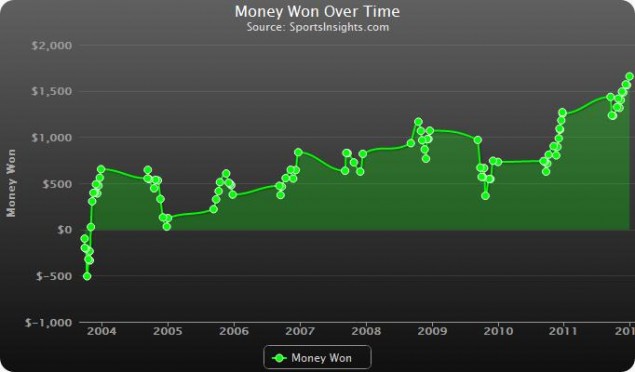
The image below is a screenshot of this Bet Labs system and results.

For anyone interested in employing this system, please be aware that the betting percentages used reflect Sports Insights’ archived Betting Trends data. Last year, we highlighted how well our 80/20 rule had been performing and had multiple readers contact us saying they bet games at the “20% level” and weren’t winning.
We quickly learned that they were using betting percentages from only one sportsbook.
Our spread betting percentages reflect the market average compiled from 6 offshore sportsbooks, not just one. Therefore, the significantly larger sample size allows us to get a much more accurate look at the sports betting marketplace. The larger the sample size, the more reliable the system matches.
At the time of publication, Bet Labs’ Current Game Matches feature shows both Tennessee (15% of spread bets) and Tampa Bay (20%) as potential Week 1 system matches.
The image below is a screenshot of this Bet Lab system’s Current Game Matches.

If you’re interested in building your own data-driven betting systems, please contact our Customer Service Department at 877-838-2853 or by email at help@sportsinsights.com to schedule a Free Live Demo of our Bet Labs software.
Tom
08/25/2012 at 5:15 pmGood stuff. It works the same way in MLB.
GregOwr
10/24/2012 at 1:16 amSeriously, this is great stuff!
No question betting against sentiment is always a strong play. I love how you quantify this and use historical data to back it up….
I will have to review your BetLabs software. Good NFL betting software such as this could be invaluable.
Thanks for the great info.
Bob baffer
07/30/2017 at 11:43 pmDoes anyone have more in formation on how this works and when exactly and more specific games it would work on ?
Dan McGuire
07/31/2017 at 8:32 amHello– you can look up all of our historical data with our Bet Labs software over at BetLabsSports.com