How Have MLB Totals Corresponded With Lower Scoring Games?
Over the past decade, there have been many changes around baseball. While the nineties were dominated by performance enhancing drugs and high-scoring games, today’s game has been defined by elite pitching and defense. This trend has only been heightened over the past four seasons.
Between the years of 2000 and 2009, there were 15 no-hitters and two perfect games (Randy Johnson and Mark Buehrle). However, since 2010 there have already been 20 no-hitters and 5 perfect games (Dallas Braden, Matt Cain, Philip Humber, Felix Hernandez and Roy Halladay). This trend helps drive home the point that Major League Baseball has evolved into a more pitching-centric game, but we were curious as to what impact that had on bettors.
Our hypothesis was quite simple: As the scoring output waned across the league, oddsmakers would be slow to adjust their totals thus resulting in additional value on the under.
Our first step in proving this theory was to compare the average runs per game and the average total (over/under) across baseball. Using the historical database used to power our Bet Labs software, we were able to quickly determine the average total and runs per game since 2005.
| Year | Runs Per Game | Average Total | Difference | Difference/Total (D/T) |
|---|---|---|---|---|
| 2005 | 9.18 | 8.9 | 0.28 | 3.15% |
| 2006 | 9.72 | 9.2 | 0.52 | 5.65% |
| 2007 | 9.6 | 9.1 | 0.5 | 5.49% |
| 2008 | 9.3 | 8.9 | 0.4 | 4.49% |
| 2009 | 9.22 | 8.9 | 0.32 | 3.59% |
| 2010 | 8.76 | 8.4 | 0.36 | 4.29% |
| 2011 | 8.56 | 8.1 | 0.46 | 5.68% |
| 2012 | 8.64 | 8.2 | 0.44 | 5.37% |
| 2013 | 8.34 | 8.0 | 0.34 | 4.25% |
| 2014 | 8.32 | 7.8 | 0.52 | 6.67% |
Now many people may be wondering how there could ever be value betting the under when the average runs per game has been higher than the average total in each of the past ten seasons. The answer is that there is no limit to how many runs over the total a game can go, but there is a limit as to how many runs under the total a game can go.
For example, let’s say there are two games with a total of 7.5. In one of those games the final score could be 2-1 and the other could be 13-9. Although one game went well under and one game went well over, ultimately there were 25 total runs scored in the two games which results in an average runs per game of 12.5 and an average total of 7.5.
Knowing that both the average total and runs scored/game had dropped consistently over the past ten years, our next step was to see how betting on the under had fared in every season dating back to 2005. To accomplish this, we simply created a new over/under betting system in Bet Labs and, selected “under” and then clicked the “season” filter.
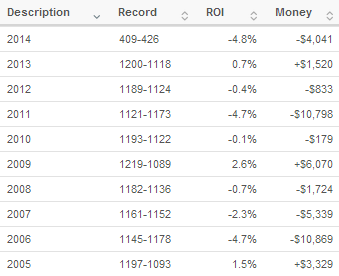
As you can see, there has been no downward trend as 2005 — the first year in our database — has actually been the second most profitable season for betting unders. However, we did notice a direct correlation between betting unders and a low D/T percentage which can be calculated by taking (runs-total)/total. This season that percentage is the highest in our database which indicates that there may be more value on the over in 2014.
This is interesting because traditionally the value has been on betting the under. Speaking in generalities, bettors tend to bet on favorites and overs because fans like to watch winners and high scoring games. We were curious as to whether public perception had actually changed, so once again we consulted our historical database to determine the average public betting percentage on the over by year.
| Year | Average Over % |
|---|---|
| 2005 | 58.95% |
| 2006 | 61.33% |
| 2007 | 59.37% |
| 2008 | 57.99% |
| 2009 | 57.19% |
| 2010 | 57.03% |
| 2011 | 59.44% |
| 2012 | 58.51% |
| 2013 | 57.92% |
| 2014 | 59.52% |
Much to our surprise, public betting on the over has barely fluctuated despite the lower totals and the decrease in scoring league-wide. This would indicate that our original hypothesis was incorrect as oddsmakers were able to adjust their totals promptly to account for the decreased scoring. The fact that public betting on the over remained essentially unchanged also indicates that these oddsmakers are highly adept at balancing their book.
Looking for the latest real-time odds and public betting trends from seven offshore sportsbooks? Try our 4-day Pro trial for just $49 and start betting like a sharp today.
No Comments