2014 MLB Betting Against the Public: Mid-Season Report
The MLB All-Star break begins on Monday and Sports Insights is pleased to present an update on this season’s most profitable first half trends as well as a betting against the public update.
We’ve had no shortage of surprises this season, and those effects have certainly been felt in the futures market. The Milwaukee Brewers, who were listed at +7000 to win the World Series at Sportsbook.com prior to the season, are currently in first place and have jumped to +1200. Similarly the Toronto Blue Jays, who were +6000 before the season started, have moved to +1500 despite being 3-games behind the Baltimore Orioles in the AL East.
We’ve also had many customers asking about which pitchers have been the best and worst to bet on this season. Although these numbers are not necessarily predictive, they can offer a unique insight into which pitchers have been outperforming expectations. The table below uses data from Bet Labs and utilizes closing lines from Pinnacle.
| Best Pitchers | Record | Units Won | Worst Pitchers | Record | Units Lost |
|---|---|---|---|---|---|
| Alfredo Simon | 15-3 | +12.24 | Jeff Samardzija | 4-15 | -11.11 |
| Chris Tillman | 12-6 | +8.66 | Brandon McCarthy | 5-14 | -8.28 |
| Phil Hughes | 12-6 | +8.60 | David Phelps | 2-10 | -8.27 |
| Henderson Alvarez | 13-6 | +7.01 | Jake Peavy | 5-12 | -7.93 |
| Dallas Kuechel | 9-7 | +6.97 | Jake Odorizzi | 6-12 | -7.42 |
It’s interesting to see that the recently traded Jeff Samardzija has actually been the best pitcher to fade this season, however, it should be noted that he has been stupendous this season (2.78 ERA, 113 K’s in 123 IP) and has been the victim of terrible run support during his time with Chicago. With a superior offense in Oakland, it’s easy to see those numbers turn around in the second half of the season.
Before the season we posted our annual MLB Betting Against the Public report which highlighted a contrarian system that had gone 295-360 for +103.78 units between 2005 and 2013. This season that system has continued to thrive and has gone 11-6 (+11.23 units, 66.1% ROI) during the 2014 campaign.
Similarly, we posted a betting against the public update for the 2014 season which proved that betting against the public at the 30% level continued to be profitable. With that in the back of our minds, we were interested what other trends had been profitable this season and whether those numbers matched up with the historical trends we have noticed.
One of the most consistent trends we have noticed in baseball is that home field tends to be undervalued which runs in direct opposition to football, basketball and hockey where bettors tend to overvalue home field advantage. This actually makes a lot of sense because baseball offers a tangible advantage above and beyond the noise and support of the crowd.
Home teams receive the last at bats and many teams are constructed to best utilize the unique dimensions of their home ballpark. However, over the first half of the season that trend has not continued with road teams being extremely profitable for bettors. As you can see in the table below, underdogs continue to be undervalued but this season simply betting all visitors would yield a significant profit.
| Criteria | Record | Winning Percentage | Units Won | ROI |
|---|---|---|---|---|
| Visitors | 675-716 | 48.5% | +35.38 | 2.5% |
| Underdogs | 628-765 | 45.1% | +9.62 | 3.3% |
| Road Dogs | 447-535 | 46.4% | +32.27 | 3.3% |
Once we had highlighted the success of road teams, we wanted to narrow our focus on the moneyline range. Historically huge underdogs have been a bad bet, so we wanted to eliminate all underdogs greater than +200. Interestingly, road dogs of more than +200 have gone just 1-20 this season with -17.77 units lost.
In our research, we noticed that our return on investment continued to rise as we narrowed the focus of our moneyline range. As you can see from the table below, the sweet spot for road dogs this season comes when we focus on underdogs of +130 or less.
| Criteria | Record | Winning Percentage | Units Won | ROI |
|---|---|---|---|---|
| Road Dogs < +200 | 446-515 | 46.4% | +50.04 | 5.2% |
| Road Dogs < +180 | 439-500 | 46.8% | +51.46 | 5.5% |
| Road Dogs < +130 | 287-271 | 51.4% | +52.43 | 9.4% |
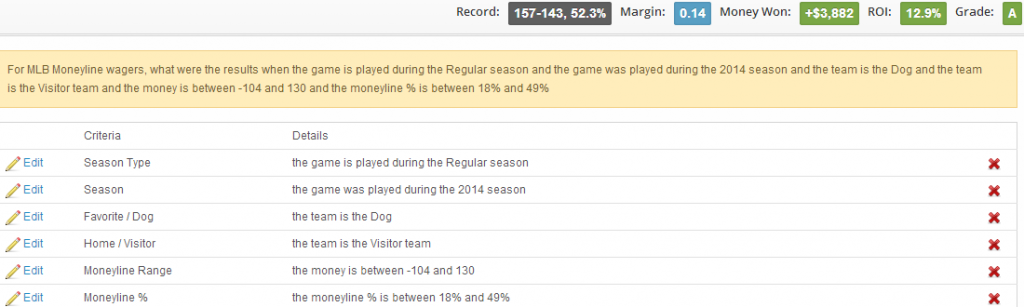
Knowing that our optimal moneyline range was underdogs of +130 or less, the next goal was to implement our betting against the public philosophy to increase the ROI of our system. The screenshot below shows the most basic contrarian filter — underdogs receiving less than 50% of public bets.
What’s amazing is that the winning percentage for this system is actually above 50% despite the fact that we’re focusing solely on underdogs. This is an incredible rarity as our highly successful MLB Best Bets have actually produced a profit of +134.6 units since 2008 despite a winning percentage of just 48.9%.
When we examine more and more lopsided bet games our overall units won drops, however, because the number of past system matches also drops we actually see our ROI rise at each data point.
| Criteria | Record | Winning Percentage | Units Won | ROI |
|---|---|---|---|---|
| 49% | 157-143 | 52.3% | +38.82 | 12.9% |
| 40% | 95-78 | 54.9% | +32.65 | 18.9% |
| 30% | 33-21 | 61.1% | +18.39 | 34.1% |
Throughout the season we will continue to post MLB betting systems, examine baseball betting trends, and answer the burning questions of the day. Bettors should also keep in mind that underdogs tend to be more profitable in games with high totals, and that following reverse line movement is an excellent way to track MLB sharp money.
Have any questions for the team at Sports Insights? Please leave a comment in the section below or e-mail us at help@sportsinsights.com.
[adrotate group=”3″]
Phil
07/23/2014 at 12:07 pmhow does betlabs determine which games were +130 or less since all of the sportsbooks have different closing lines?
is this based off of just one sportsbooks line then? or the average of all of them?
Dave S
07/23/2014 at 12:09 pmAll of the line information in Bet Labs is from the well-respected Pinnacle sportsbook. Although you can also build systems use opening lines in Bet Labs, these all refer to the closing lines.
Joel
01/07/2015 at 12:30 amDo you have results for the full 2014 MLB season? And what’s the ROI of betting on +1.5 run line for all underdogs and for only big underdogs?